

Editor’s Note: This story originally appeared in the February-March 2016 issue of Vertical.
Areas of precipitation can be serious flight hazards for helicopters, and convective precipitation, with its dangerous turbulence, even more so. Both hazards are best located and tracked by weather radar. No meteorologist would attempt to make a weather forecast without radar data. And no helicopter pilot should fly without first looking at radar, either.
The technologies of radar and flight have long been intertwined, sharing much of the same history. Radar’s origins can be traced back to 1904, when German scientist Christian Hulsmeyer obtained a patent for a device which could detect distant objects by bouncing radio waves off them. By knowing the pointed direction of the transmitter and the length of time for the energy to go out and come back, an exact location of the target could be ascertained. But little was done with this new invention until the 1930s. As the storm clouds of war developed in Europe, the fear of aircraft being used as unstoppable offensive weapons grew. Many countries turned to radar technology as a method to detect enemy aircraft at a great distance. The British were the leaders in developing operational radar systems and shared this knowledge with their American allies (although it was actually the U.S. Signal Corps that came up with the acronym radar for radio detection and ranging in 1939).
Radar was then used extensively in World War II to detect enemy planes, but occasionally radar displays would be “corrupted” by large areas of returns, which were found to indicate areas of precipitation. Although a hindrance in the detection of planes, this anomaly showed meteorologists the value of radar as a tool to detect and track areas of rain and snow. By 1943, using radar to detect areas of precipitation was commonplace. After the war, weather radar units were developed for civilian use. Today, the United States, Canada, and most developed countries have weather radar networks providing almost continuous coverage.
Unsurprisingly, modern weather radars are far more sophisticated than the original radars that were developed. In terms of the basic transmitter, we use microwaves not radio waves. The shorter wavelengths allow for a much clearer and more detailed picture of the observed weather. Technically, some of the transmitted energy is “back scattered” by the precipitation targets — and that is what is picked up by the radar receiver. The amount of signal returned to the receiver is a function of target size, and the returned signal is given in decibels or dBZ.
For rain, larger droplets will send back a stronger signal. On the original radar sets, this was just displayed as a brighter “echo” on the screen. As technology advanced, it became possible to show the strength of the return through the use of different colors on the display image. Since droplet size correlates well with rainfall intensity, the colorized radar display is able to indicate both the intensity, and, through statistical correlations, estimate the amount of rainfall that will accumulate. On standard radar displays, “cool” colors such as blue and green indicate low intensity and “hot” colors like yellow and red heavy rainfall.
Rain, of course, is only one form of precipitation: purely liquid water. We also have various forms of frozen precipitation: snow, sleet, and hail. Since water is five times more “reflective” than ice, these other precipitation types produce varying radar returns. Hail, pieces of ice formed when water at below freezing temperatures (super-cooled water) coalesces on a particle, shows up as a very strong return (often purple) on radar, if there is still some liquid water on the outside of the hail stone. If the hail is dry (no outside water), then it will not show up well on radar. Fortunately, the latter is the less common type.
Radar returns from snow follow the same principle. Wet snow (large, heavy flakes that occur with temperatures near freezing) produces strong returns. Drier snow, common with colder temperatures, does not show up well. A vertical radar scan in winter often shows a “bright band” which corresponds to the freezing level.
Also, to show up as a radar return, the droplet or ice crystal must have a certain amount of mass. Non-precipitating clouds or fog will not show up on radar, as the droplets or ice crystals that make up the cloud are too small.
Many of today’s radar sets also have Doppler capability. The Doppler effect is the shifting of the frequency of electromagnetic waves from a moving object. This movement, at least the component towards or away from a radar set, can be detected and displayed on a radar screen. This was a major breakthrough for severe weather forecasting since most thunderstorms that produce severe weather have an element of rotation in them. Doppler weather radar was developed in 1960s and became standard by the late 1980s.
Besides the basic 360-degreesweep, there are various adjustments that radar operators can use to get a more detailed look at returns. Firstly, the antenna can be tilted vertically to scan precipitating cells, which can give a more detailed vertical cross section of the cell as well as showing the top of the it (at least in terms of radar returns). The scan rate can also be slowed, which can provide radar imagery of targets typically too small to show up on a typical scan.
Knowing the Limits
While the capability of weather radars today is hugely impressive, they do have some fundamental problems that must be taken into consideration when using them. The first of these is attenuation, which occurs when the radar signal strikes the forward portion of a heavily precipitating cell. Most of the signal returns you’ll see displayed are from this forward part; much of the signal doesn’t penetrate the heavy rain area. Therefore, the region behind this screen of rain may show up as weak returns or even precipitation free. You cannot assume this is the case, and should still avoid this area. Although modern radars have reduced this effect, they have not eliminated it altogether.
“Ground clutter” is another problem. In this instance, the radar signal will bounce off large solid objects that will show up on the radar screen, while possibly masking true weather targets behind them. This is especially true in cities with tall buildings and in mountainous terrain, and you will see an anomalously strong target or targets on the scope. Some weather radars do have a Ground Clutter Suppression (GCS) function that takes care of some of this, but those operating around these areas still need to be wary.
For pilots, weather radar has long been an essential tool to detect convection and its associated turbulence. Although standard radar can only detect precipitation intensity, heavy rainfall rates (larger droplets) are typically associated with strong updrafts within the cloud. These updrafts are typical in convective clouds. So, it can be inferred that heavy rainfall areas (yellow and especially red returns on the radar screen) indicate moderate to strong convection and its associated turbulence. Purple returns from hail indicate extremely strong updrafts and dangerous turbulence. Doppler radar can detect turbulence more directly by examining changes in horizontal motions of targets indicating changes in wind direction, but its short range can limit its utility.
In addition, although radar will not directly detect areas of clouds or fog, if precipitation is indicated, obviously there are clouds producing it. Even below the precipitation-producing cloud deck, visibility will be lowered by fog generated by the precipitation and by the precip itself. So, it can be inferred that any precip areas showing up on radar may well contain IMC.
The United States, Canada, and other developed countries have weather radar networks comprised of numerous radar sites to give almost total coverage over land and extending out somewhat over coastal waters. In the U.S., besides the standard radars, many terminals serving large metropolitan areas have Terminal Doppler Weather Radar (TDWR) units. Developed in the early 1990s, TDWR has a superior range and angular resolution, and was designed specifically to determine wind shear (a rapid change in wind speed and/or direction, which has been implicated in a number of major aircraft accidents).
In today’s world of electronic communications access to ground radar, data is routine, especially as government-run radars are readily accessible. (In the U.S., the Aviation Weather Center of the National Weather Service can be accessed at aviationweather.gov/radar; in Canada, the Aviation Weather Website can be found at flightplanning.navcanada.ca.) You can also choose from a wide variety of radar and/or aviation weather apps (such as RadarScope and MyRadar) to access surface radar data. Aviation weather apps that include radar info include SiriusXM Aviation, WSI Pilotbrief Optima, ForeFlight, Garmin Pilot, and WingX.
One drawback of viewing radar data online is that there is a lag time between the actual radar observation and the time in which it is posted. This is due to the time it takes to process and present the data. Often the actual observation time is displayed on the screen although in reality it may be up to 20 minutes old. This could be critical in some bad weather situations. And, of course, if you lost computer communications, you would have no radar data available.
Taking Radar into the Air
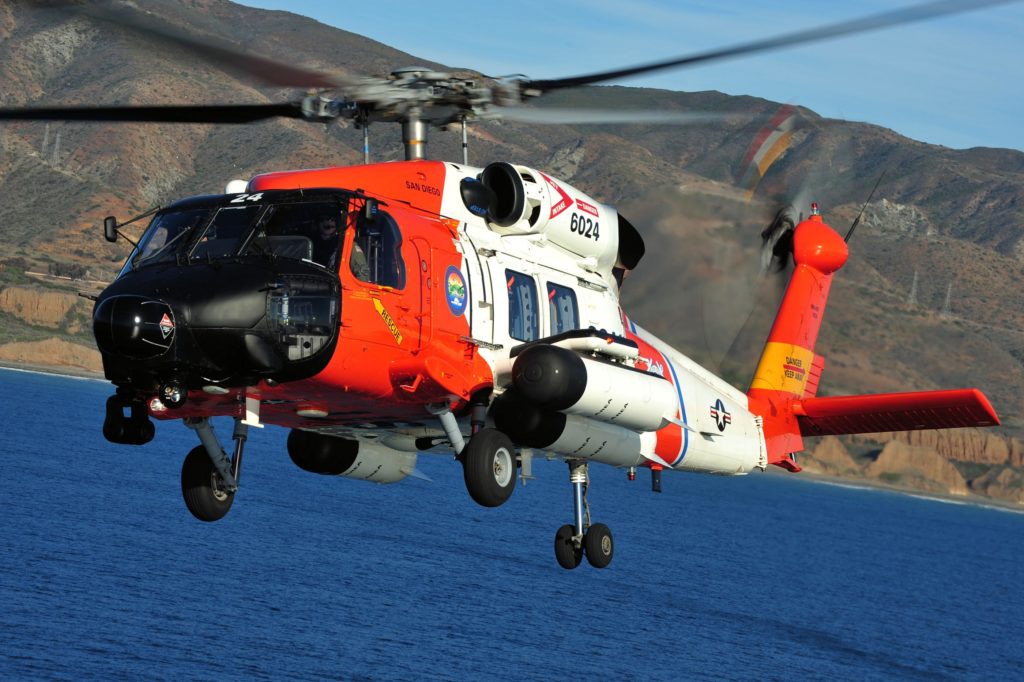
Reliance solely on ground-based radar data has its limitations. If feasible (especially economically), your helicopter can be equipped with its own weather radar. Airborne weather radar was developed in the late 1940s and by the 1960s was standard in commercial airplanes. There are a number of advantages to having your own weather radar. You can have continuous radar data at your disposal, and it is always current. You have radar input even when there are no ground sites (such as over remote land areas and oceans), and the fact that the radar is airborne also helps, allowing significant convection to be detected over 300 nautical miles away.
These lightweight radar units (some as little as 4.5 kilograms or 10 pounds) have flat antennas that usually range from 25 to 60 centimeters (10 to 24 inches). The larger, more powerful (and more expensive) sets will be able to detect more targets and at a greater range. The radar is typically installed in the front of the aircraft and enclosed by the “radome” — a weatherproof cover that protects the device from the environment (precipitation, sand or dust, and ultraviolet rays). The cover must be made of a material tough enough to protect the equipment but still allow unimpeded movement of the microwave signal. Typically, the radar display uses four colors: green for light precipitations, yellow for moderate, red for heavy, and magenta for extremely heavy rain and/or hail.
Another advantage of an inflight radar system is that it can be adjusted to provide maximum information on weather targets. You can change the tilt of the antenna typically 15 degrees above or below the horizon to vertically scan a target. The attenuation factor (the possibility of dangerous weather being hidden from radar view), can be mitigated to at least some extent by changing the tilt angle on the radar to do more of a vertical scan. There is also a gain control, which changes the sensitivity of the receiver. You can enhance or “turn down” targets showing on the screen. Typically though, the radar is set on automatic scan. Most units are equipped with functions to automatically detect and warn the pilot of possible threats.
A capacity shared by many onboard radar sets is turbulence detection. The “TURB mode” infers turbulence from the standard radar returns. Doppler capability allows the radar to detect if targets are moving towards or away from the aircraft. If the Doppler returns show rapid changes in the motion, turbulence can be expected. Of course, the cloud must contain precipitation-sized particles to be seen at all on radar. Unfortunately, this Doppler-related capability only works out to about 40 nautical miles. Turbulence inside a non-precipitating cloud, dry convective turbulence, and clear air turbulence (CAT) cannot be detected by radar. The same is true for wind shear; it can only be indicated if it is accompanied by precipitation.
Having your own weather radar can be a great tool in avoiding adverse or even dangerous weather situations. But like any piece of equipment, you must learn how to properly use it to maximize its benefits. Conversely, improper use of the radar or misinterpretation of radar images can lead to poor flight decisions.